Joanne Rodrigues

Data science × demography × social science

Turn data into decisions about people.

I write about the techniques that explain why people behave the way they do, and how to measure, forecast, and change it. Two books and a video course, from product analytics to population-scale demography.

Books & video course

Practical guides and training for data scientists, product teams, and decision-makers who work with data about people.

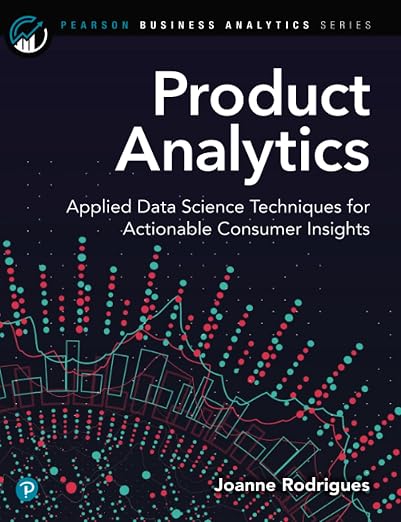
Cover of Product Analytics
Available now

Product Analytics

Applied Data Science Techniques for Actionable Consumer Insights

Addison-Wesley Data & Analytics Series · 2020

Product Analytics is a complete, hands-on guide to generating actionable business insights from customer data. It introduces practical statistical techniques for determining why things happen and how to change what people do at scale, paired with social science methods for building better theories and metrics and driving faster, more sustained behavior change.

Written for entrepreneurs, product managers, marketers, and other business practitioners, it teaches through intuitive examples from both web and offline environments. Light on math, it walks you step by step through choosing the right technique for each application, running the analysis in R, and getting answers you can trust.

  • Develop testable theories of individual and social behavior in web products
  • Build better metrics and KPIs for any product or system
  • Run more informative A/B tests, then go beyond them with difference-in-differences, regression discontinuity, propensity score matching, and uplift modeling
  • Project user populations and business needs with demographic techniques
  • A/B testing
  • Causal inference
  • Metrics & KPIs
  • Behavior change
  • Uplift modeling
  • R
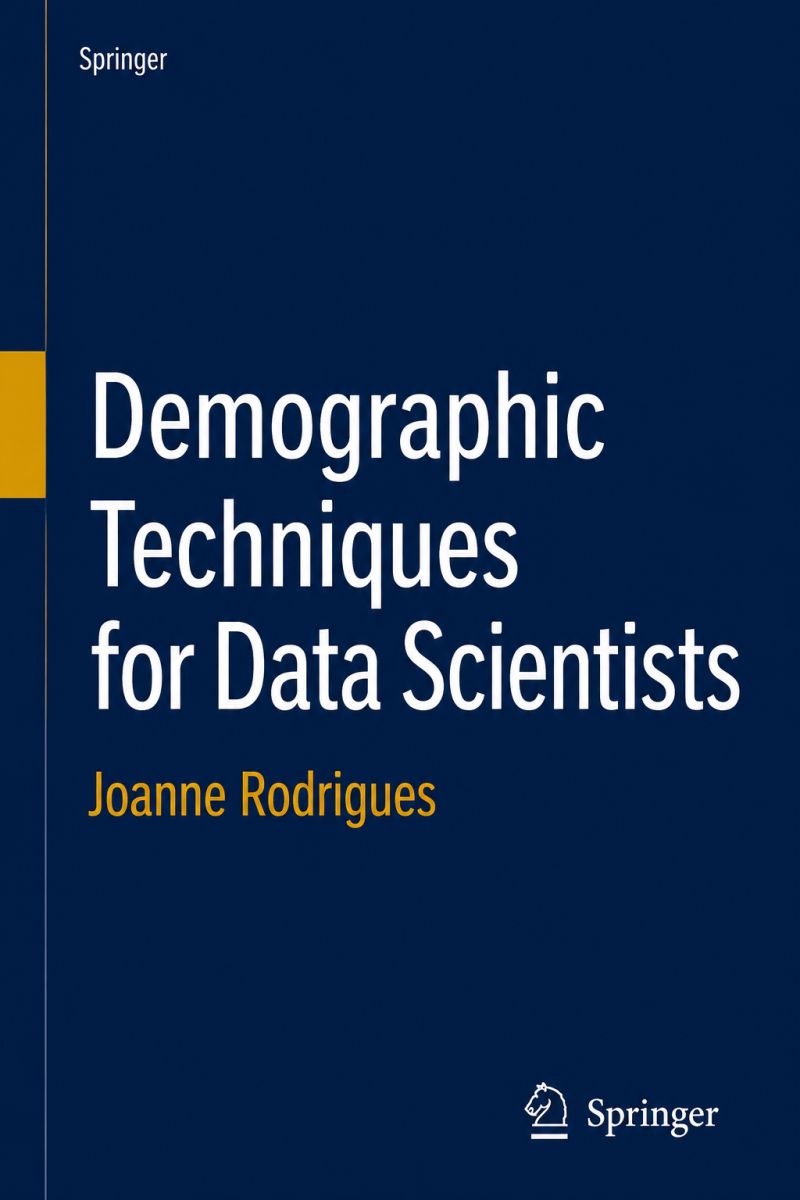
Cover of Demographic Techniques for Data Scientists
Coming December 2026

Demographic Techniques for Data Scientists

Population thinking for metrics, models, and fairness in machine learning.

Springer Nature · Forthcoming, December 2026

Demographic Techniques for Data Scientists brings over 500 years of demographic insight into modern data science practice. For centuries, demographers have rigorously studied how populations evolve over time, developing sophisticated approaches to measurement, forecasting, and the statistical examination of population. These tools, deeply grounded in the interaction between population and time, offer powerful, underutilized perspectives for today’s data scientists.

The book starts with the foundations of robust metrics, then applies them to one of the field’s most pressing problems: finding and addressing bias and discrimination in machine learning. It culminates in the SHIFT Framework, a step-by-step methodology grounded in the patterns of behavioral data, with code in Python and R.

  • Build robust, consistent metrics across period, age, and cohort, with principled exposures and denominators
  • Reinterpret everyday data science metrics, like precision and recall, through population and time
  • Evaluate bias in machine learning with subgroup analysis, causal inference, and algorithmic impact assessments
  • Integrate census and survey data with behavioral datasets to measure who your models really serve
  • Demography
  • Metrics
  • Census & survey data
  • Algorithmic bias
  • Causal inference
  • Python
  • R
Inside the book: chapter overview
  1. Developing Robust and Consistent MetricsThe foundational concepts of period, age, and cohort, and how to build simple metrics across them. Essential for understanding the interplay of time and population in metrics and models.
  2. The Craft of Complex Metric ConstructionPeriod-based metrics, exposure variables, and principled denominators and rates, plus path dependence and funnel metrics for population flows. Implemented in Python and R.
  3. Demographic Techniques for Data Science MetricsApplying population and time to common data science metrics such as precision and recall, with theory and code.
  4. Metrics to Assess DiscriminationEvaluating bias in machine learning through population representativeness: subgroup analysis, causal inference with observational data, and structured evaluation across demographic groups.
  5. The World of Census DataThe history, methodology, and global context of census and survey data, including the United States, Canada, India, and Brazil.
  6. Census and Survey Data IntegrationBuilding metrics from U.S. American Community Survey and international census data, and integrating them with behavioral datasets. Python and R examples.
  7. Mapping Conceptual and Demographic Variables in ModelsTurning preferences, heuristics, and decision-making patterns into measurable variables, the limits of conventional ML approaches to bias, and a framework for human heuristics of bias and discrimination.
  8. Algorithmic Impact Assessments and BenchmarkingEvaluating model performance in real-world contexts, including bias, coverage, and representativeness, with frameworks for external benchmarking.
  9. The SHIFT FrameworkA step-by-step methodology for addressing discrimination in machine learning, built on the underlying patterns of behavioral data, with applied case studies.
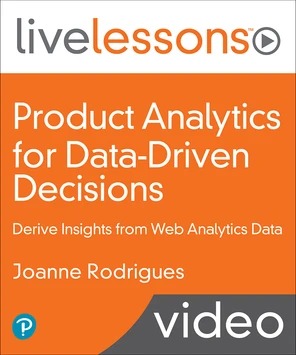
Cover of the Product Analytics for Data-Driven Decisions video course
Video course · 7h 16m

Product Analytics for Data-Driven Decisions

Derive Insights from Web Analytics Data

O’Reilly · Pearson · June 2022 · Beginner to intermediate

Eight video lessons on the core concepts for working with data: spotting bias in datasets, telling good data from bad, and turning findings into actionable business decisions. Real-world examples show how to use qualitative and quantitative measures to reach the outcomes you want. No prerequisites.

  • Identify and create effective metrics and KPIs that drive growth
  • Avoid common mistakes when interpreting data
  • Progress from raw data to inference and strategic decisions
  • Metrics & KPIs
  • Theory building
  • Behavior change
  • Survey design
  • Index creation
  • A/B testing
Inside the course: lesson outline
  1. Explore the Data-Generating ProcessPart 1: Theory building techniques in product analytics
  2. Theory BuildingPart 1: Theory building techniques in product analytics
  3. Behavior ChangePart 1: Theory building techniques in product analytics
  4. Basic Statistical Techniques and Common PitfallsPart 2: Testing theories, feature and metric development
  5. Conceptualization, Operationalization and Metric DevelopmentPart 2: Testing theories, feature and metric development
  6. Metric Development ProcessPart 2: Testing theories, feature and metric development
  7. Index CreationPart 2: Testing theories, feature and metric development
  8. A/B TestingPart 2: Testing theories, feature and metric development
Joanne Rodrigues

About the author

Joanne Rodrigues

Data scientist, author, entrepreneur, and public policy leader specializing in artificial intelligence, demographics, and equitable technology.

She is the author of Product Analytics (Addison-Wesley) and Demographic Techniques for Data Scientists (Springer Nature), and is currently building tools to integrate demographic techniques into data science workflows.

Joanne is the founder of Clinic Price Check, a healthcare transparency company named a TechCrunch Battlefield SF 2020 finalist. She has more than a decade of experience applying data science, machine learning, and causal inference to complex problems across technology, healthcare, and government, including leadership roles at MeYou Health, Machine Zone, and Sony PlayStation, where she managed analytics teams and developed data-driven products.

She currently leads data and technology initiatives for Cal/OSHA, applying advanced analytics and machine learning to evidence-based occupational safety policy. Her projects include statewide predictive modeling to prevent occupational heat-related fatalities and Valley Fever deaths.

Education

UC Berkeley: master’s in Political Science and in Demography
LSE: M.Sc. Applicable Mathematics
Georgetown: B.S.F.S. International Political Economy

Speaking & workshops

Keynotes, workshops, and talks for conferences, companies, universities, and podcasts.

Keynote · 45 min

Why Do Users Do What They Do?

How combining social science with data science produces better theories of behavior, better metrics, and product decisions that actually change what people do.

Workshop · Half day

Beyond A/B Testing

A hands-on tour of causal inference for when experiments are impossible, expensive, or not enough: difference-in-differences, regression discontinuity, propensity scores, and uplift modeling.

Talk · 30 min

Demography for Data Scientists

What 500 years of population science can teach modern data teams about metrics, time, and measurement for any organization that serves people.

Talk · 45 min

Measuring Bias in Machine Learning

Why conventional bias-removal methods fall short, and how demographic thinking helps you evaluate representativeness, impact, and discrimination in real systems.

Schedule me to speak Email an inquiry Include the event, date, audience size, and format.